Understanding SEO Data Visualization with Sequence Stats
SEO data are complicated and complex to monitor with the bare eye. Thus, it is important to get the SEO data visualization as clear as possible. As SEO strategies evolve and become increasingly data-driven, the role of data visualization has emerged as a critical element in understanding, interpreting, and leveraging the vast amount of data generated.
Read this article thoroughly to get the best SEO data visualization tool.
The Importance of Data Visualization in SEO
At its core, SEO is about improving a website's visibility on search engines to attract organic traffic. This involves optimizing various factors, from on-page elements to off-page backlinks. The effectiveness of these strategies, however, heavily relies on the ability to analyze and interpret complex data sets, often consisting of a lot of metrics.
Data visualization serves as a bridge between raw data and actionable insights. It transforms seemingly abstract numbers into clear, meaningful visuals, thus allowing SEO professionals to quickly identify trends, anomalies, and correlations that might otherwise remain hidden.
By presenting information in a visual format, data visualization simplifies the process of understanding the performance of SEO efforts and their impact on a website's overall success.
The Function of SEO Data Visualization
Data visualization isn't just about creating visually appealing charts and graphs; it's about empowering decision-making. SEO professionals and marketers often face the challenge of translating complex technical data into actionable strategies that resonate with stakeholders.
Data visualization facilitates this by presenting information in a manner that is easily digestible and accessible to both technical and non-technical audiences.
Moreover, the connection between data visualization and informed decisions extends beyond internal teams. In an era where collaboration and communication are paramount, visually compelling data presentations foster effective communication between SEO experts, content creators, developers, and executives.
When everyone involved can visualize the impact of their actions and contributions, it becomes easier to align strategies and work towards common goals.
How to Get SEO Data Visualization with Sequence Stats
Harnessing the power of SEO data visualization is now simpler than ever with Sequence Stats. This innovative tool enables you to transform complex data sets into intuitive and insightful graphics, offering a comprehensive view of tracked keywords' performance.
Here's how you can effectively leverage this tool to unlock valuable SEO data:
1. Comprehensive Multi-Form Graphics
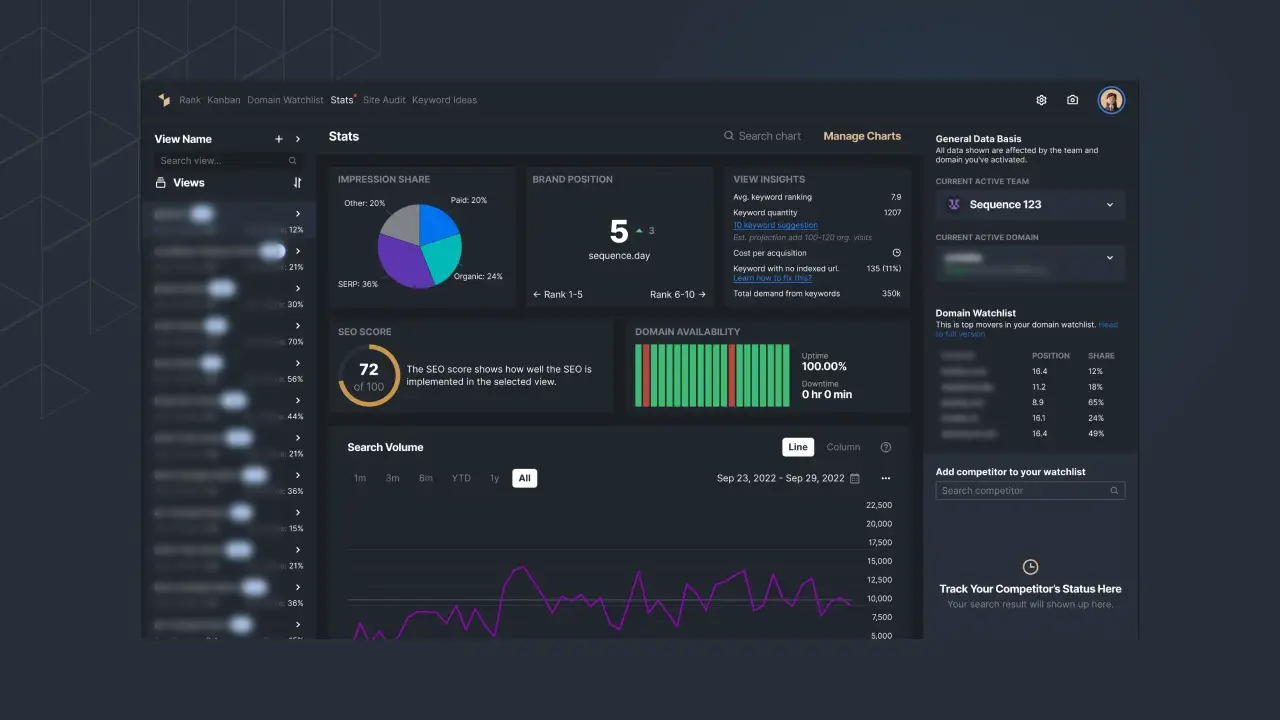
Sequence Stats boasts a diverse range of graphic formats that present your tracked keyword data in various ways. From dynamic line charts to interactive bar graphs, pie charts, and more, you can select the graphic format that best suits your data visualization needs.
 |
|---|
| Picture 1 - Stats feature overview |
2. Tracking Key Metrics
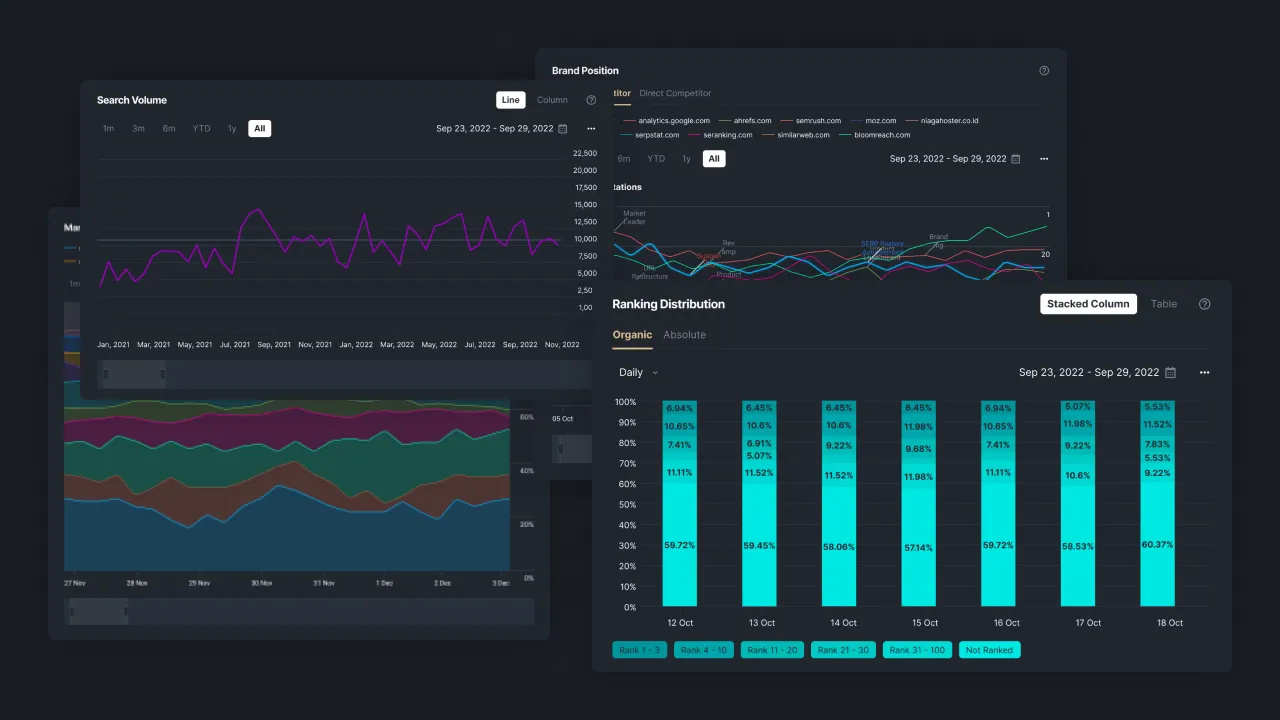
Besides the visualization, Sequence Stats also allow you to track crucial metrics such as market share, average ranking, brand position, impression share, ranking distribution, and search volume.
Sequence Stats consolidates these metrics into a visual representation, giving you a clear understanding of your keyword performance. The ability to simultaneously monitor multiple metrics enhances your decision-making process.
 |
|---|
| Picture 2 - Sequence Stats data visualization. |
3. Easy Date Range Setup
With Sequence Stats, setting up the date range for your data visualization is easy. Whether you're interested in weekly, monthly, or custom intervals, the tool lets you define the timeframe that aligns with your analysis requirements.
4. Intuitive User Interface
Sequence Stats prioritizes user-friendliness. The tool's intuitive interface allows you to effortlessly navigate and configure your data visualization preferences. Even if you're not an expert in data analysis or visualization, the tool's design ensures that you can easily access and interpret your tracked keyword by having SEO visualization.
Sequence Stats empowers you to transform raw data into strategic decisions. By leveraging its multi-form graphics, tracking key metrics, and customizing settings, you can unlock the potential of your keyword performance analysis.
Whether you're an SEO expert or a beginner, Sequence Stats ensures that your SEO data visualization journey is as informative as it is accessible. Register now and explore all the features freely by trying our free trial program!