View Insight
View Insight on Sequence
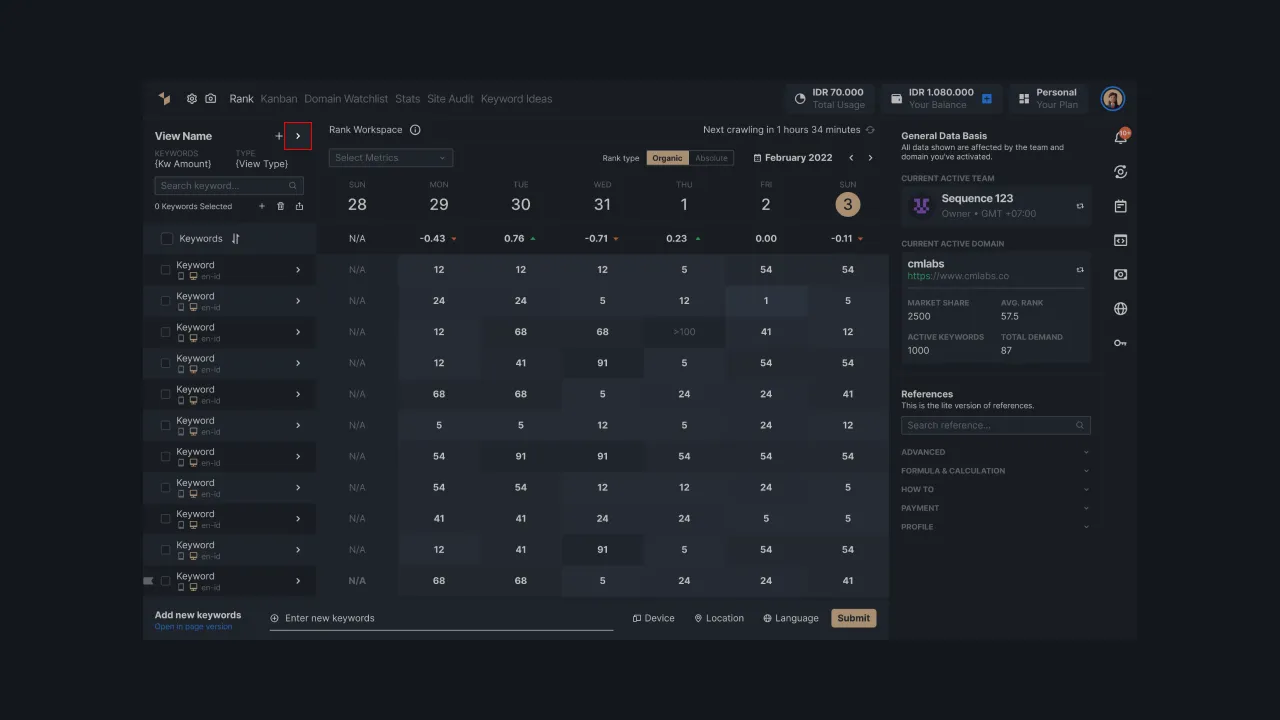
View insights are some important metric information that you can find through the View menu in Sequence. In the View feature, you can have a keyword tracking list grouped by specific categories. By default, you have a View named All Keywords that contains all the keywords you are tracking using Sequence. To display View Insights, you need to press the arrow icon next to the Add View menu.
 |
|---|
| Figure 1: Button to display View Insight |
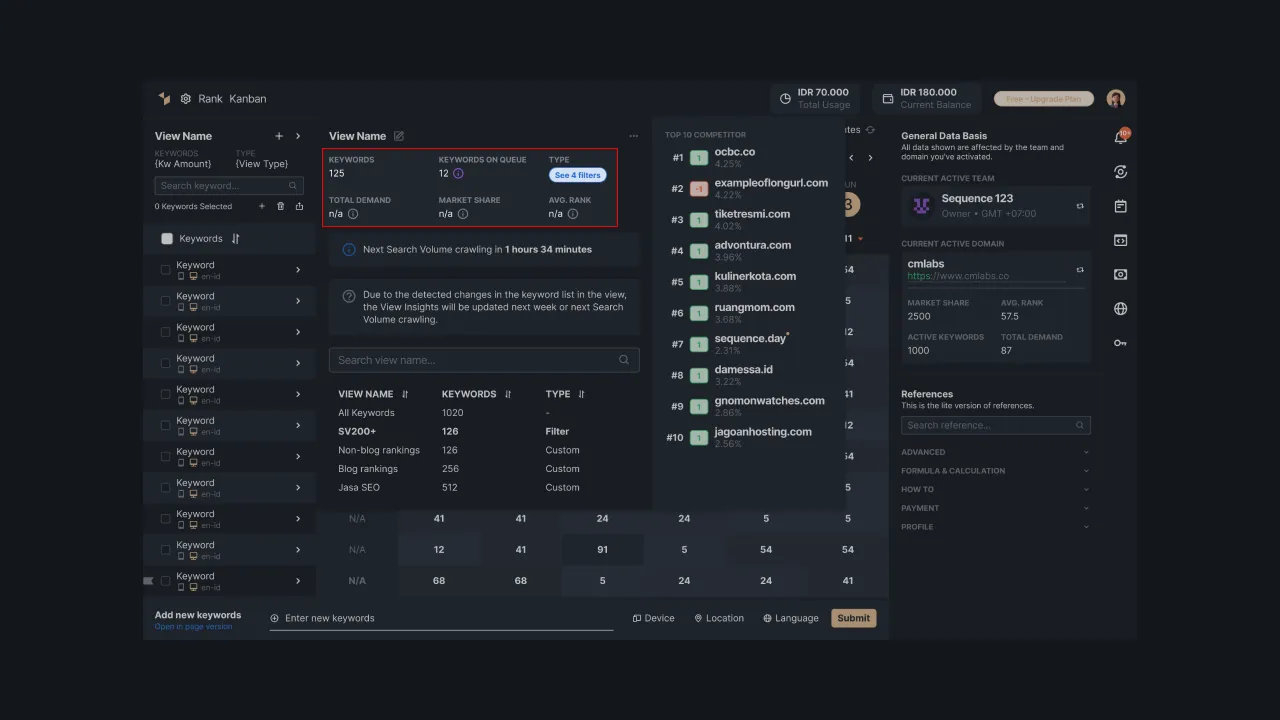
After pressing the arrow button, here is what View Insight looks like on Sequence.
 |
|---|
| Figure 2: View Insight View on Sequence |
This feature is able to display Average Rank, Total Demand, Market Share, and Top Competitors. Information and data about these metrics are very useful in helping you monitor your keywords. Here's a complete list of all the metrics in View Insights:
Average Rank
Average Ranking is a metric that displays the average value of today's keyword ranking in a particular View which is tracked using Sequence. We take the data from 1-100 rankings on SERP pages, then display the average value of organic and absolute rankings.
The average ranking value is obtained by calculating the total ranking of keywords contained in a particular View, then divided by the total keywords in that View. The calculation of the average ranking also includes keywords with > 100 ranks in the SERP.
Take a look at the simulation of calculating the Average ranking in the table below:
Keywords
Ranking
| Keywords | Ranking |
|---|---|
| Jasa SEO | 5 |
| Jasa SEO bulanan | 5 |
| Jasa SEO Jakarta | 2 |
| Jasa SEO Malang | 2 |
Table 1: Simulation of calculating the average ranking of keywords in a particular View
To determine today's average ranking, you can calculate today's total ranking by adding up each keyword rank (5+5+2+3). After that, divide by the number of keywords (4).
avg ranking = (5+5+2+3) / 4
avg ranking = 3.5
Total Demand
Total demand is the total number of search volume (SV) on a particular View in the past week. The search volume crawler runs once a week, precisely on Sunday, to get the latest SV data. Thus, the data displayed also refers to the last week's SV.
If you add new keywords in a View, the new total demand data will be updated the following week according to the search volume crawling schedule. You can use this data to monitor how many keywords in a View are searched by internet users.
Market Share
Market Share shows the percentage of market share of your domain compared to competitors in the same market. You are said to dominate the market if the market share value of your brand is higher than competitors. These values will also affect the position of your brand.
To determine the percentage of market share, you need to calculate the SoV (Share of Voice). The SoV value represents the estimated visibility and dominance of your brand compared to competitors, obtained by multiplying the Click-Through Rate (CTR) and Search Volume for each keyword in your domain.
CTR x SV= SoV
After knowing the SoV value, you can define the total market share of your brand by adding up the SoV of all the keywords in your domain. To calculate the total market share, add up your brand's SOV with the SOV of all your competitors.
Next, the market share percentage is obtained from the division between your brand's total market share and the total market share, then multiplied by 100. If you get a market share percentage of 58.40%, then all of your competitors will fight for a market share of 41.60% for the same keywords.
Top Competitors
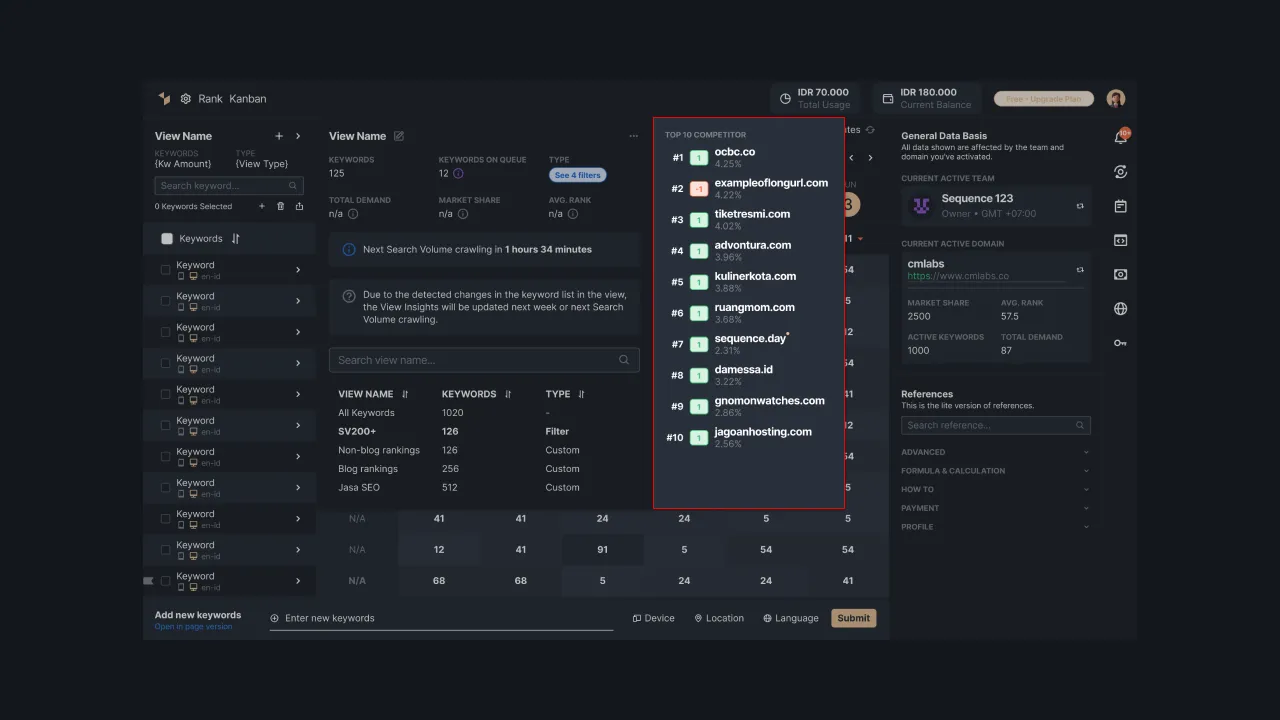
In the View Insights, you can also find out the top 10 competitors for keywords in a certain View. This metric contains 10 of your business competitors which will be updated daily. This data is obtained from the percentage of market share on the keywords you are targeting in the selected View.
If your domain is not included in the top 10, you can still see the ranking information and your domain's market share under the list of top 10 competitors. Besides the top 10 competitors, this metric also displays the ranking changes from day to day as indicated by a number in the box to the left of the competitor's name. For example, the number 0 indicates that there has been no change in the competitor's ranking from the previous day.
This data is useful for you to see who your competitors are in the same market. In addition, you can use this data to conduct a Competitive Analysis in the future.
 |
|---|
| Figure 3: Display of Top 10 Competitors on View Insight |
That is the explanation regarding the metrics contained in the View Insight of Sequence. If you need help understanding it deeper and want to increase your SEO visibility, feel free to contact our team via email at support@sequence.day