Rank Dashboard Description
Rank Dashboard Description
Rank Dashboard displays the daily ranking of keywords in both desktop and mobile SERPs. You can view your keyword ranking history because Sequence stores the data since the first time you added a keyword. There is also a ranking distribution of all tracked keywords, making it easier for you to know the distribution of keyword rankings.
Our system provides a fairly complete data analysis. You can find out the SEO metrics of each keyword being tracked from SERP feature data, search volume, cost per click, competition (index value), and others. Knowing SEO metrics will help you find solutions to improve the quality of the implemented SEO.
The following guide is structured to help you identify the components found on the Rank Dashboard and Keyword Details pages in Sequence.
Rank Dashboard
The first page you will see after selecting a team is the Rank Dashboard. On this page, Sequence displays a list of your team's keywords, keyword ranking data, keyword metrics, and ranking distributions in attractive and easy-to-understand visual data.
To reload data next to the currently displayed keyword, you can simply press the “Refresh Data” button at the top right of the Keyword Metrics. This button serves to display the latest data results from each keyword.
You can customize the workspace appearance through the Settings menu in Sequence. There is an option to enable dark or light mode for your workspace. In addition, you can also set the use of language whether it is Indonesian or English.
The following is an explanation of the components contained in the Rank Dashboard:
1.Keyword List
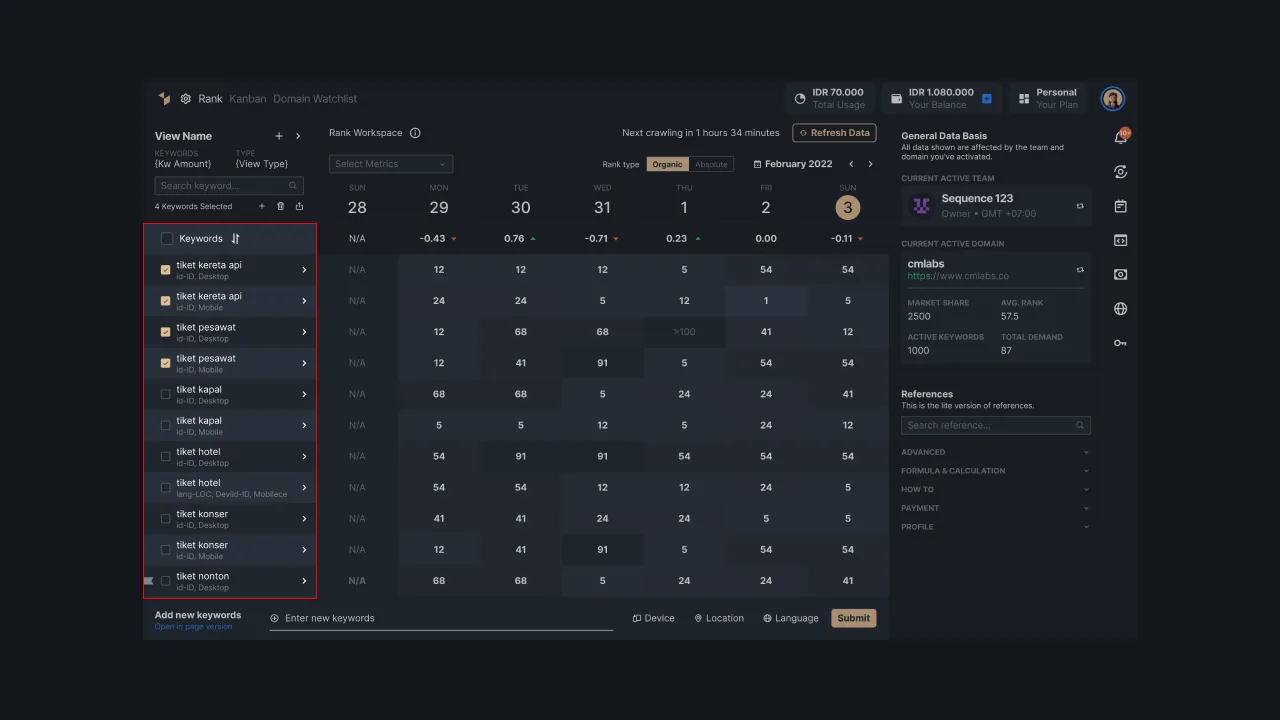
On the left side of the Rank Dashboard, Sequence displays a list of the keywords your team is tracking. You can pin keywords that are considered important so that the system will put them in the top position to make it easier for you to monitor these keywords. You can also see the keyword details by pressing the next icon on the right side of the keyword.
 |
|---|
| Figure 1 - List of tracked keywords |
2. Keyword Rank
One of the main features of Sequence is that it displays the ranking of the keywords being tracked on the SERPs. The system will automatically display the ranking summary of each keyword for the last 7 days (according to the time zone set on each team).
For example, when you have two teams with different time zones, team A (GMT+7) and team B (GMT-11). Let’s say you open the rank dashboard page on February 8, 2022, at 07.00 (GMT+7), then the rank dashboard for the two teams will display different data.
In team A (GMT+7), you will see keyword ranking data from February 2 to 8, 2022. Meanwhile, in team B with a slower time of 18 hours (GMT-11), you will only see ranking data from 1 to 8 February 7, 2022, because currently in team B (GMT-11) it has not yet entered the date of February 8th.
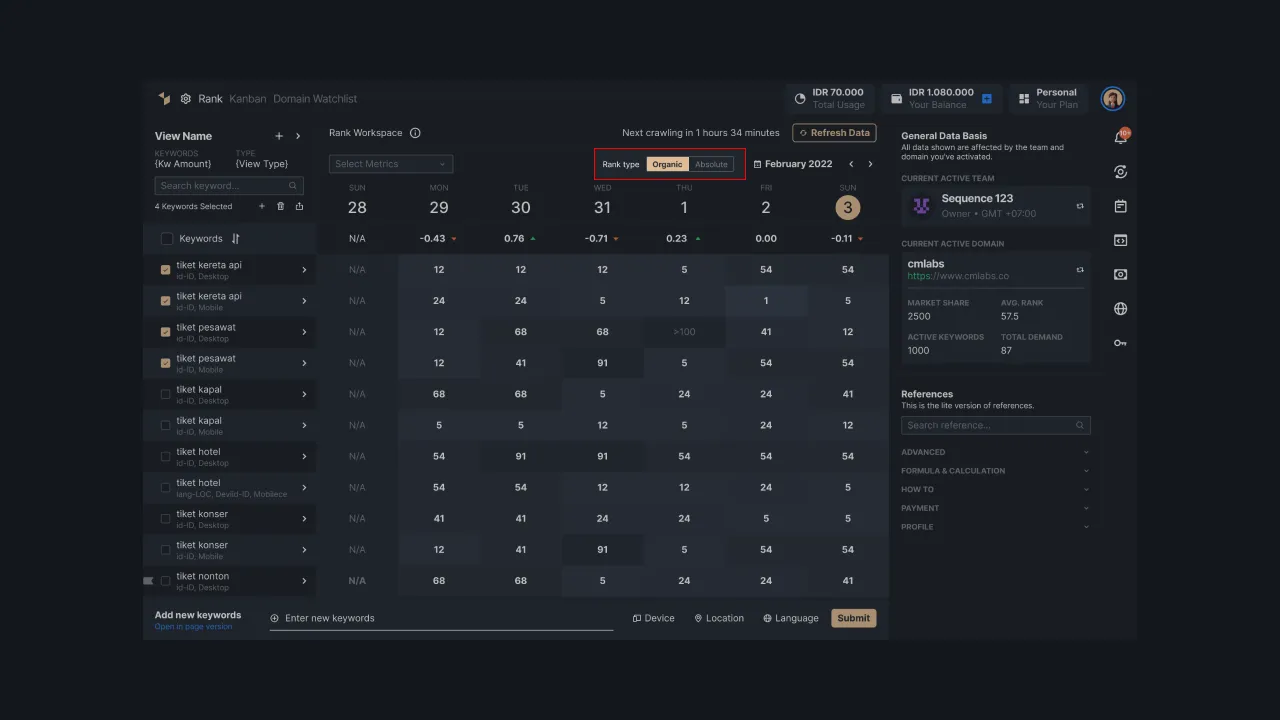
With Sequence, you can display keyword rankings based on organic or absolute rankings by pressing the option at the top of keyword rankings.
If you select organic ranking, then the system will only show ranking based on organic search results. However, if you select absolute ranking then the system will display the ranking based on the order of paid search results and organic search results.
 |
|---|
| Figure 2 - Filter data by ranking type. |
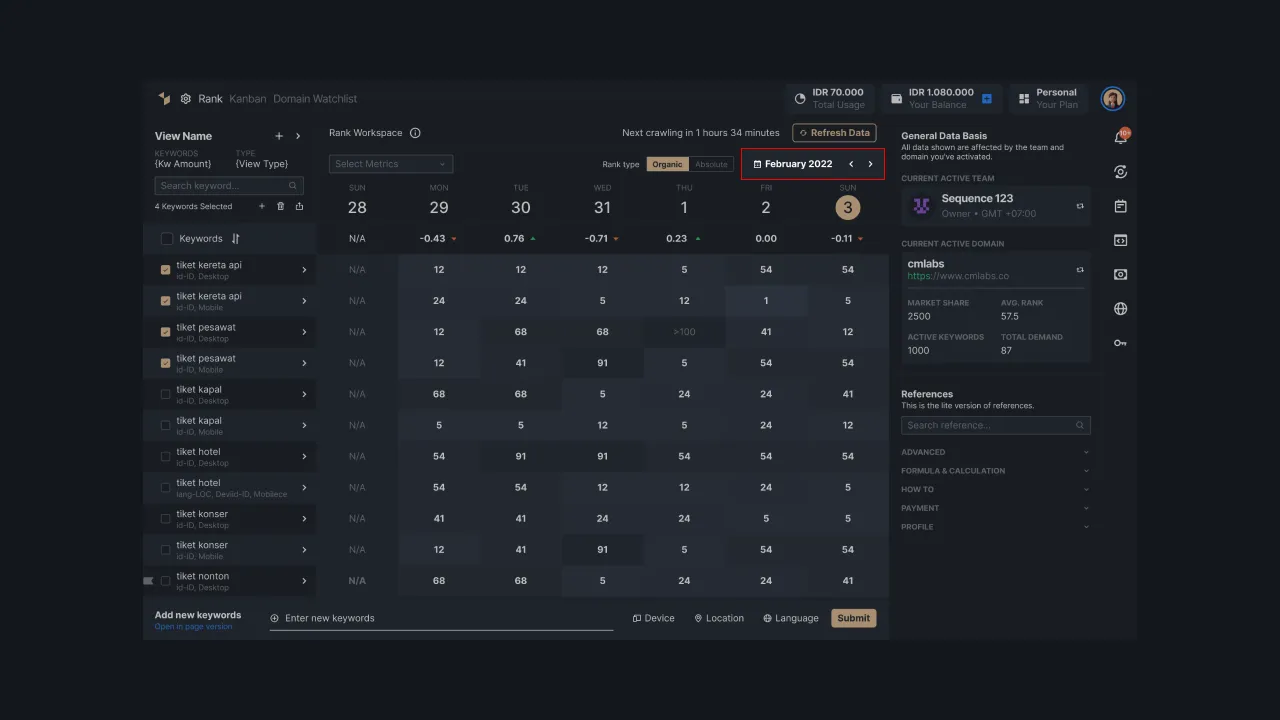
You can also display keyword rankings based on the selected date by pressing the date option at the top. Then, the system will display the keyword ranking on the selected date up to 6 days before the data. To go faster, press the navigation previous/next to display the data for the past 7 days (according to the time zone set on each team).
 |
|---|
| Figure 3 - Filter data by specific time period |
In this keyword ranking section, we provide different color indicators for each range of ranking values. You will see data related to the day and date of tracking, the average value of keyword rankings plus the signs of increasing or decreasing rankings compared to the previous day, as well as daily ranking data for each keyword for the last 7 days (according to the time zone set on each team).
The calculation of the average daily ranking of keywords is obtained from the sum of the keyword ranking values divided by the number of keywords, without including non-ranking keywords. For example, if you have 10 keywords that are tracked and today 6 of them are ranked, then we will calculate the average ranking from the sum of those ranking values divided by the number of keywords that are ranked, which is 6.
You can also see the average keyword ranking value with an arrow icon on the left side that shows the average change in ranking compared to the previous day. An increase or decrease in ranking is determined by calculating the difference between the previous day's average and today's rating.
If the results of the calculation of the difference in the average rating display a positive value, the arrow icon will be green, indicating that the average rating has increased. On the other hand, if the difference is negative, it means that your average rating has decreased, which is indicated by a red arrow icon.
| Figure 4 - Daily ranking of keywords |
3. Keyword Metrics
In addition to displaying the ranking of keywords, on the rank dashboard you can also see the SEO metrics for each keyword. SEO metrics allow you to measure the effectiveness of the SEO that has been implemented and help you determine corrective steps based on the data presented to improve your business performance.
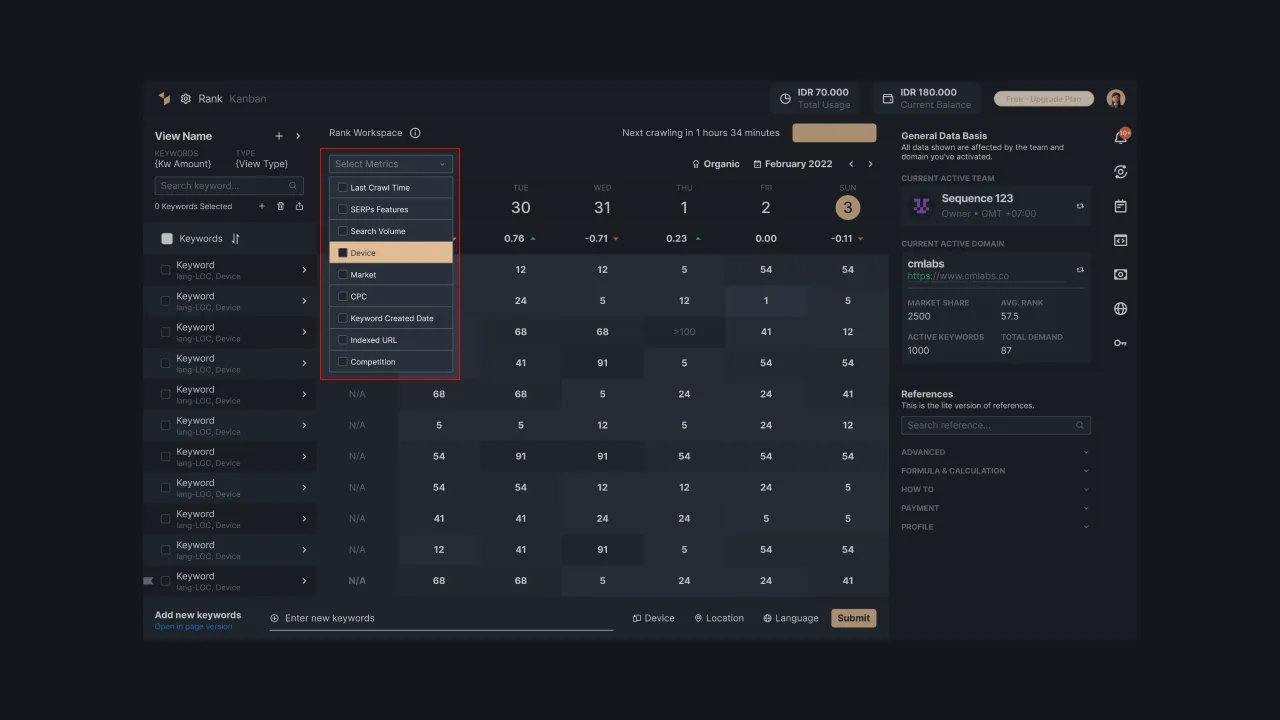
You can customize the displayed metrics by pressing the checklist on the selected metrics. The system limits users so that they can only display 5 metrics out of a total of 9 metrics. If you want to choose other metrics, then remove the checklist in the previous selection first.
 |
|---|
| Figure 5 - Displayable SEO metric options |
We provide a brief explanation so that users understand better the keyword metrics contained in Sequence.
- SERP Features: Displays the number of SERP features the keyword has. If you specify this value, the system will display a tooltip containing the SERP feature. SERP features include organic results, people also ask, knowledge graph, video, image, related search, local pack, etc.
- Search Volume: This helps you find out data regarding the number of searches on a keyword in a certain period of time. Keywords with high search volume have a potential for high traffic, so you can use this data to determine the use of appropriate keywords in your content.
- Device: Displays the type of device the user has selected to perform keyword searches, both desktop, and mobile.
- Market: It is a representation of the selected target market. Usually set based on the country or location used as the target market.
- CPC (Cost per Click): The cost per click for each keyword is shown in dollars. The fee is calculated from the total cost to be paid to the advertising service provider divided by the total clicks on the ads that are displayed. The formula CPC = total cost of advertising: total clicks.
- Indexed URL: Displays the indexed URL that corresponds to the keywords in your domain. Our system will only crawl data that is in positions 1-100 in the SERP, so if you can't find the indexed URL it's possible that your website is not in the top 100 positions in search results.
- Last Crawl Time: This provides you with information about the last time the system crawled the tracked keyword. Data is displayed in date and time format.
- Competition (Index Value): This shows how competitive the competition is on the keywords used. The value range of the competition (index value) is low, medium, and high. This value is also determined by competitors who share the same market. The more competitors with high domain authority share the same keywords, the higher the competition value for these keywords will be.
- Keyword Created Time: Indicates when the keyword was first added to the keyword tracking list in Sequence.
- Keyword Tag: Grouping keywords based on the label you give to them. It allows you to observe the keyword separately on the View feature.
4. View Sequence
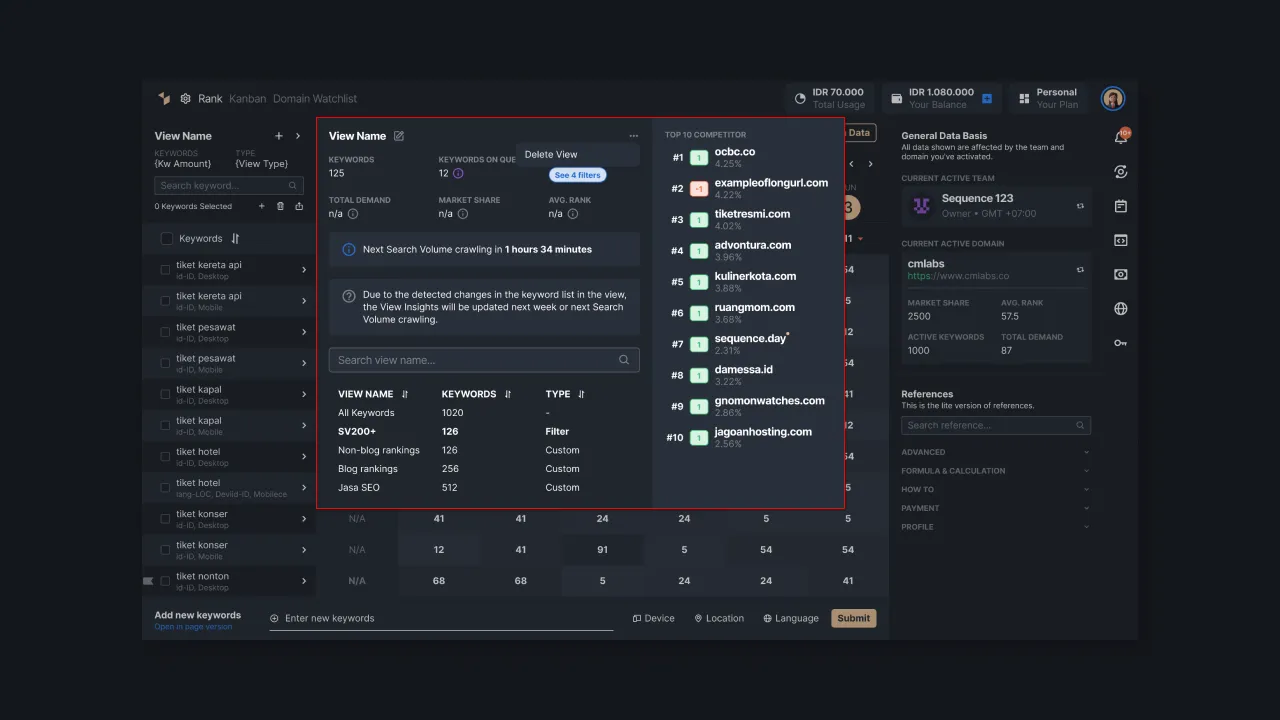
View makes it easy for you to see the tracking result summary of a particular group of keywords. This feature will be useful for you who have a list of keywords from several different niches. With the View, you can set certain keyword categories to help you display tracking results more easily.
The data displayed includes the rank distribution presented in the form of a pie chart containing the distribution of your domain rank from 1-100 positions in the SERP. In addition, you can see the number of keywords in the view. You can also view and search for the view used to display the data. To add a new view, please access the following View Management Guide.
 |
|---|
| Figure 6 - Distribution of keyword ranking |
Keyword Details
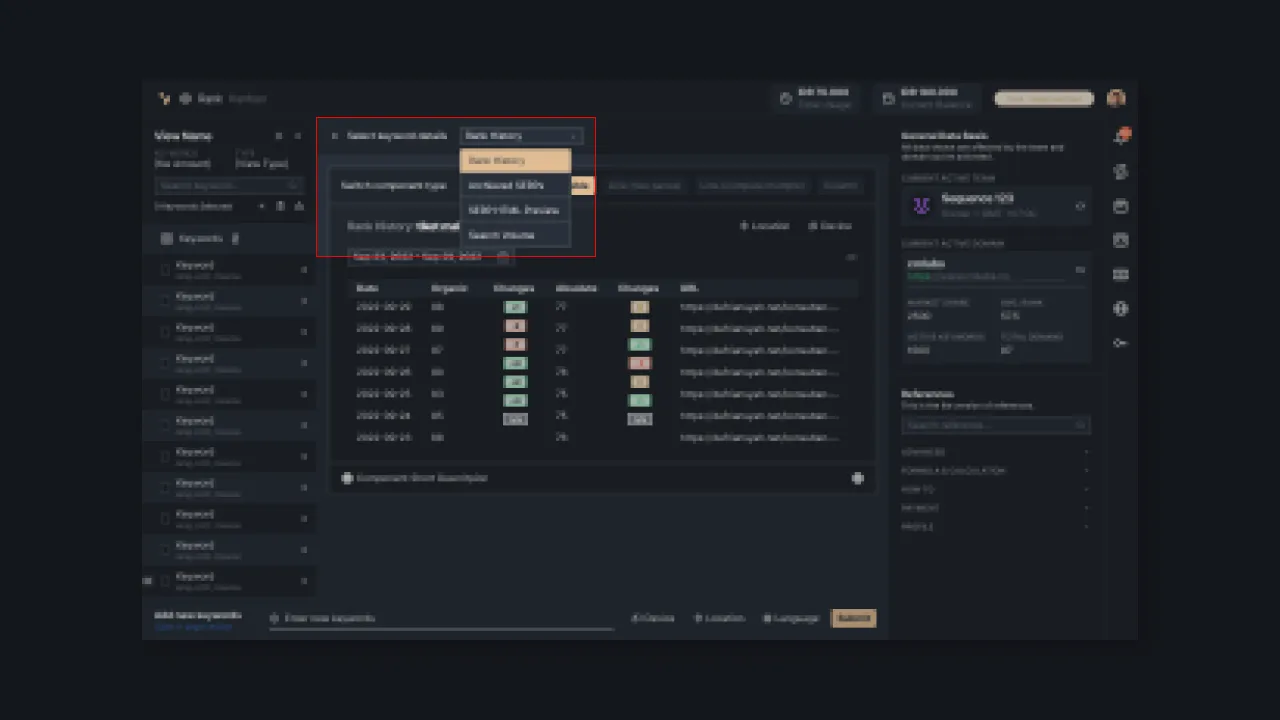
The system will display the Keyword Details page when you press the next icon on a keyword. This page provides a detailed ranking analysis for each keyword with an easy-to-understand data visualization. The data displayed includes tracked keyword ranking history, archived SERP list, SERP preview, and search volume of the selected keyword.
 |
|---|
| Figure 7 - Option keyword details |
1.Rank History
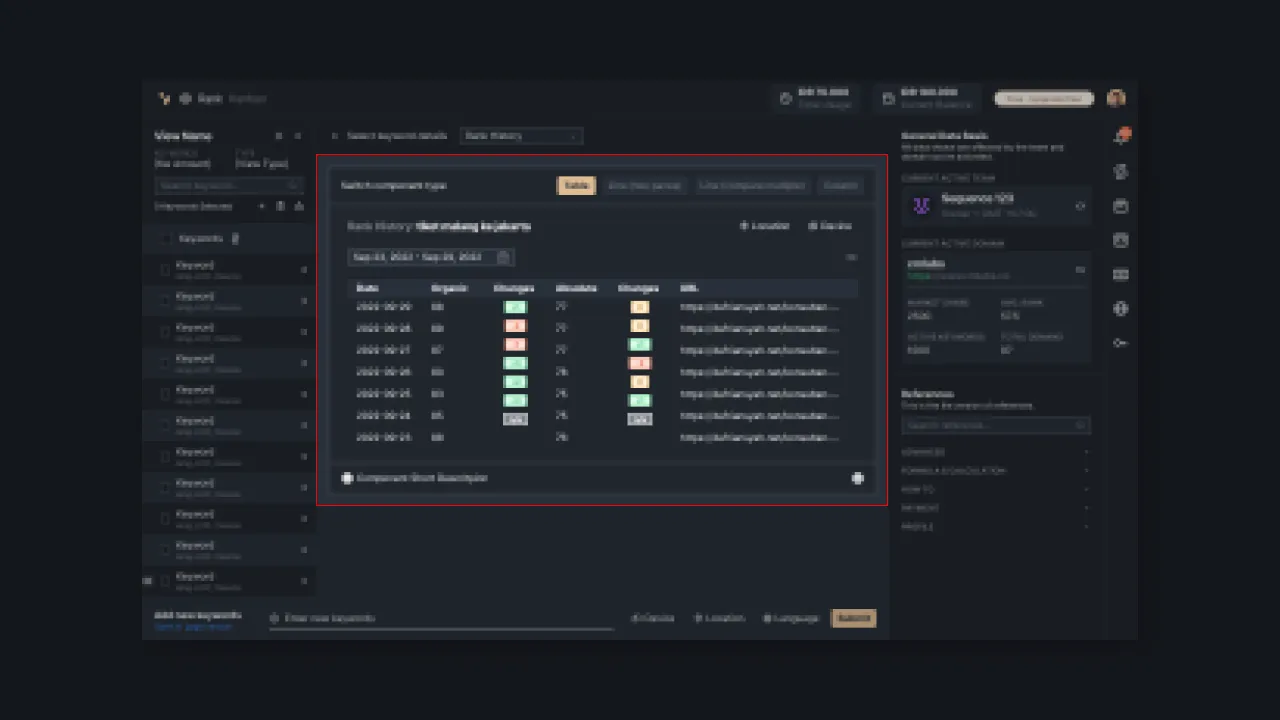
Rank history displays the organic and absolute ranking history of the keywords you are tracking. Ranking data is retrieved from the first time you add that keyword in Sequence. You can choose to display data in the form of tables, line graphs, or column graphs.
The data displayed in the ranking history table includes tracking date, organic rank, absolute rank, organic/absolute rank change, URL address, and SEO concern that contains information about whether your URL is safe or not.
 |
|---|
| Figure 8 - Keyword ranking history table |
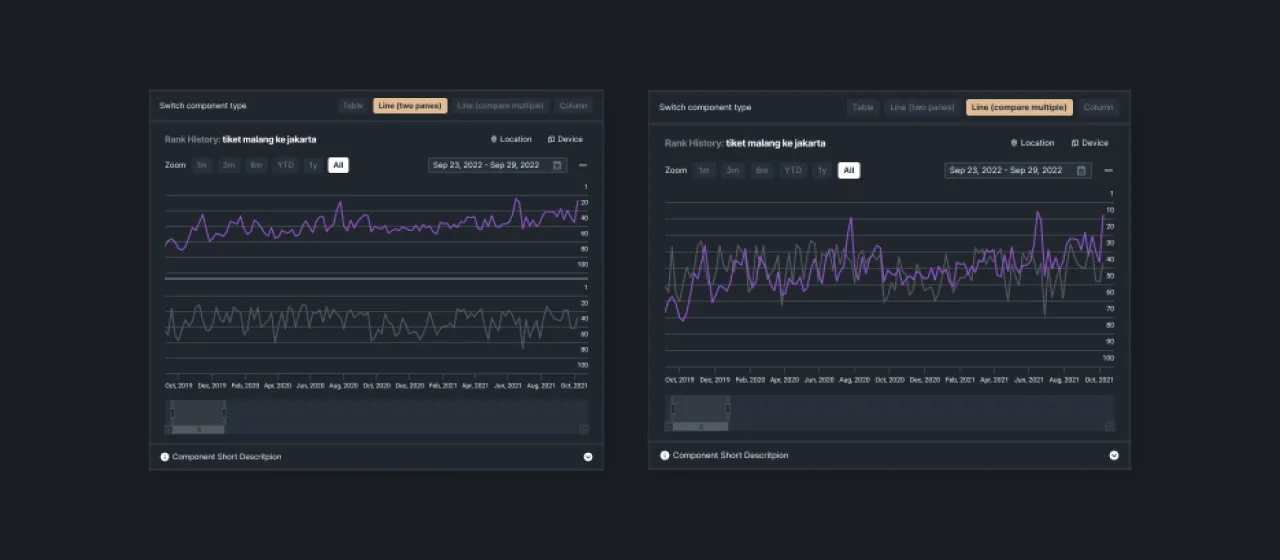
In the line graph view, you will see the difference between the absolute and organic rankings of the selected keywords. You can choose to display data from the last few months as well as all keyword ranking data.
 |
|---|
| Figure 9 - Keyword ranking history line graph |
Same with the column graphs, the system will display a comparison between organic and absolute rankings. You can choose to display data from the last few months, data from the beginning of the year to the present, or all historical keyword ranking data.
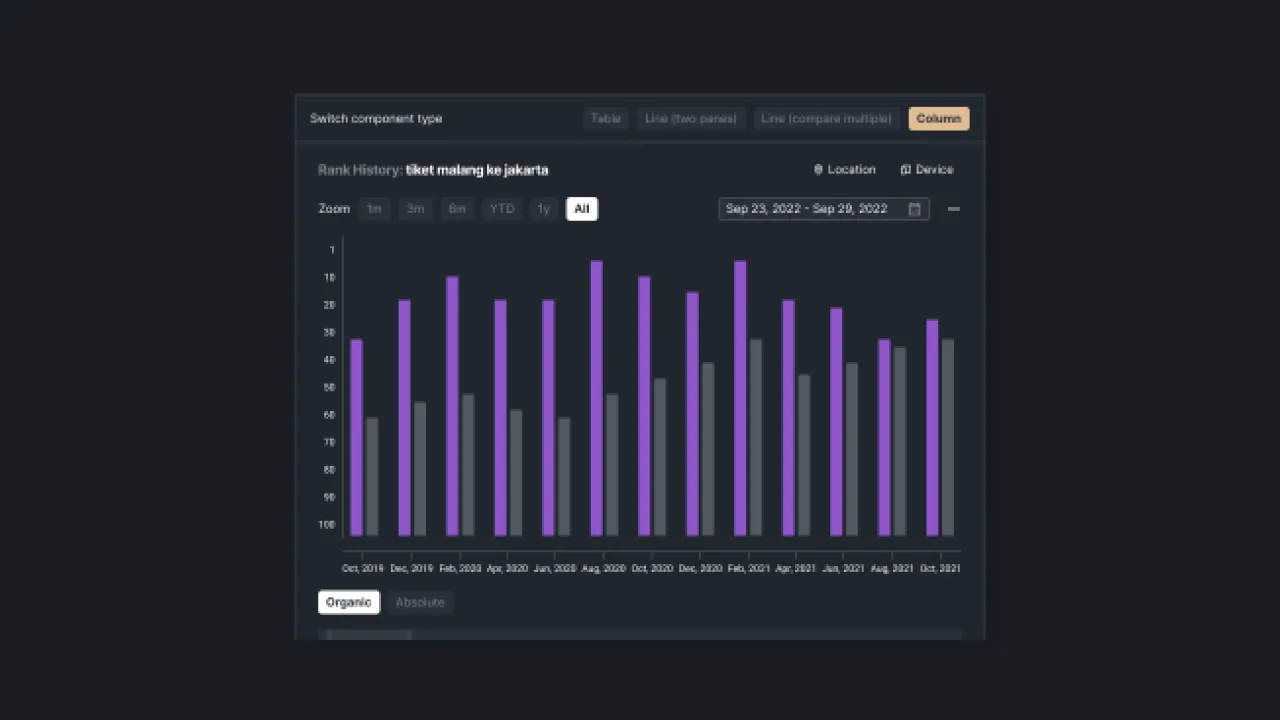 |
|---|
| Figure 10 - Graphic of keyword ranking history column |
2. Archived SERP
On the Archived SERP, Sequence keeps a list of websites from 1 to 100 in the SERP that are related to your keywords. The data stored in the table includes organic rankings, absolute ratings, SERP features, the protocols used and warnings about the protocol's security, and the URL of the website.
With this data, you can find out the position of your domain compared to competitors' who share the same keywords in the SERP. Furthermore, you can also determine the strategic steps that will be applied to optimize the website so that it increases the position of your domain in the SERP.
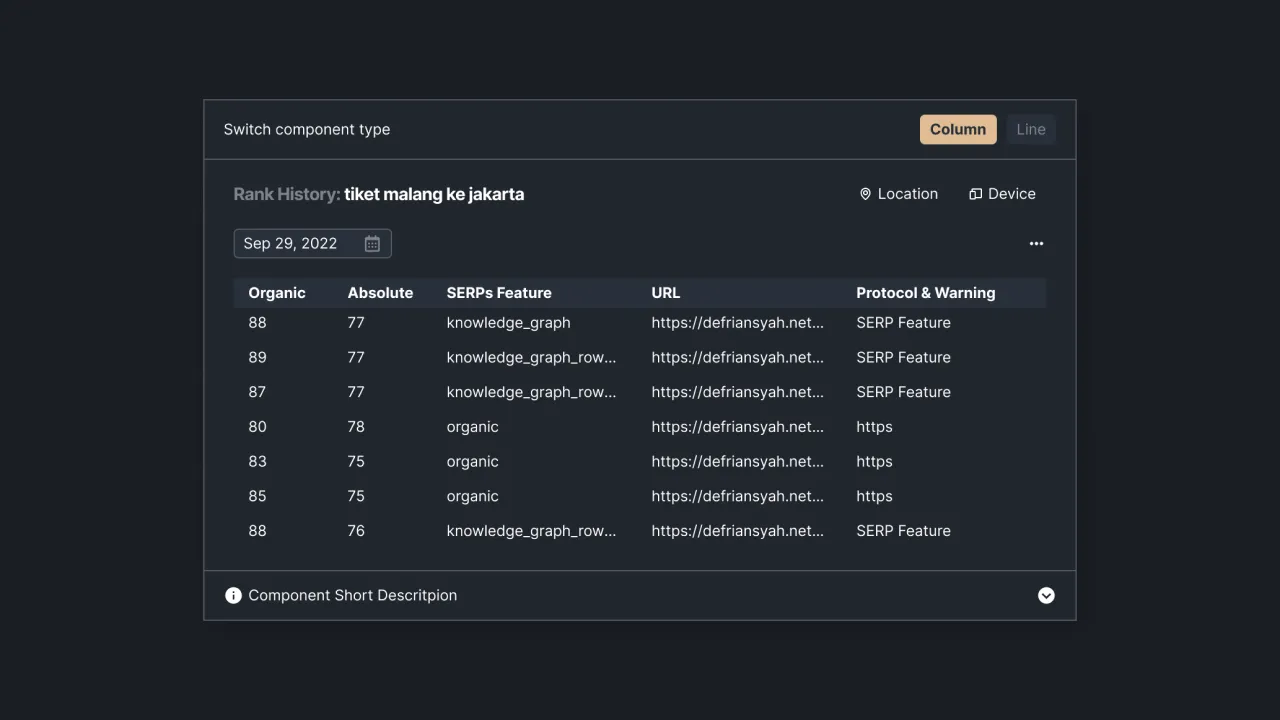 |
|---|
| Figure 11 - Data archived SERPs |
3. SERPs HTML Preview
We provide a function that allows you to preview the SERP page of the keywords being tracked. That way, you can find out the search results of the keywords entered without opening your search engine.
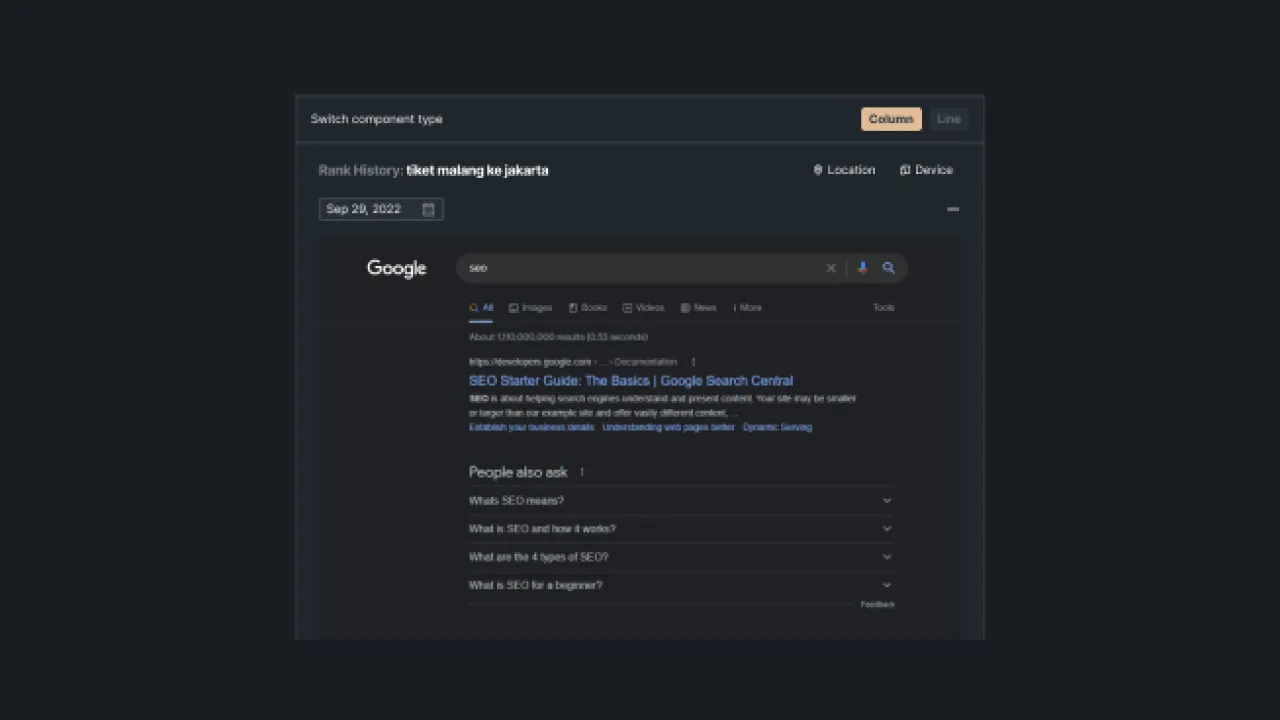 |
|---|
| Figure 12 - Preview HTML SERPs |
4. Search Volume
Search volume will display the number of keyword searches tracked in a month. By knowing this data, you can determine the right keywords for your content. The use of keywords with a high number of searches in content has the potential to increase traffic to your website.
Sequence allows you to view data for the last few months as well as overall keyword search volume data. Column graphs and line graphs are available to make it easier for you to see the distribution of search volume data. The bold line at the back of the graph indicates the average search volume for that keyword.
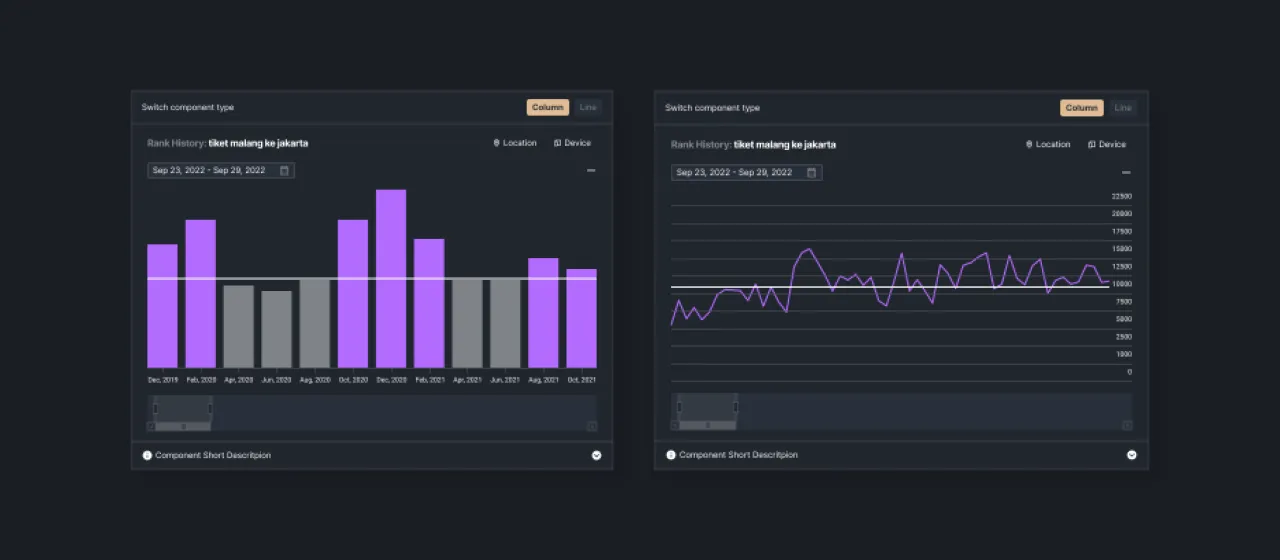 |
|---|
| Figure 13 - Graphic of keyword search volume |
How to Export Keywords
Sequence allows users to export keywords to Excel, CSV, or image files. Users can export all keywords as well as some specific keywords. Here's how.
Export All Keywords
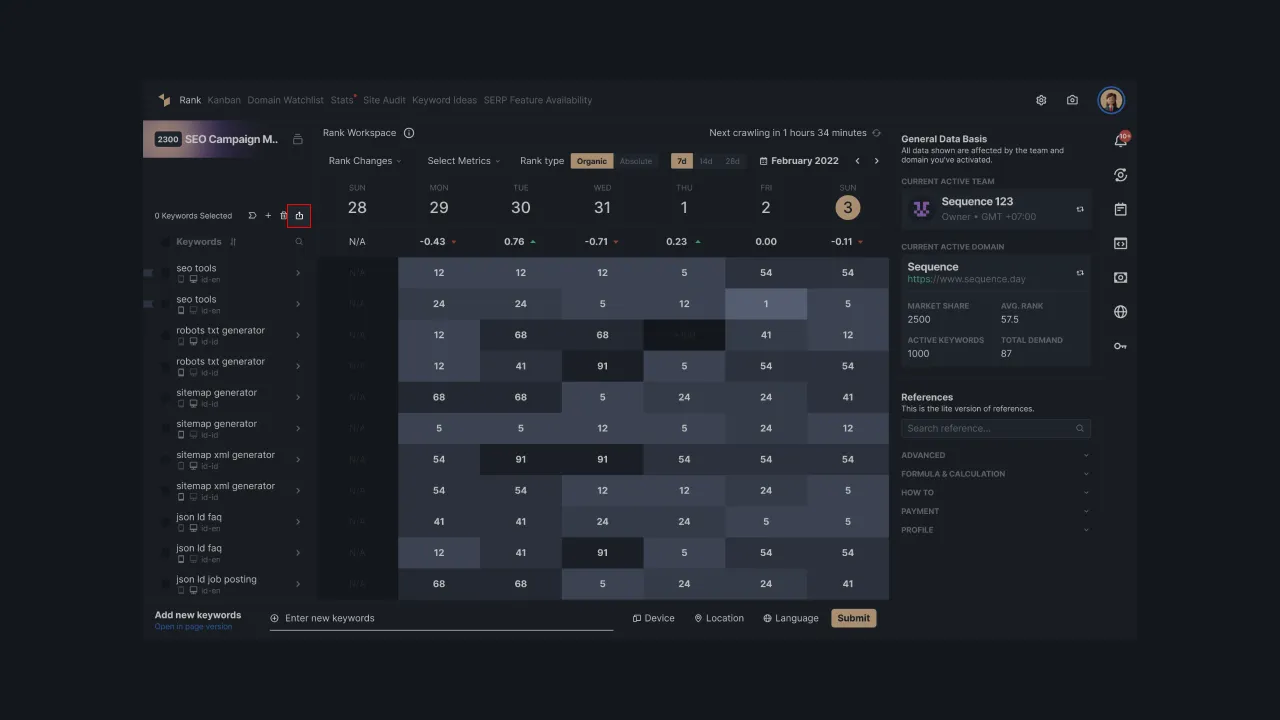
First of all, open the Rank dashboard on one of the domains you want to export. In the keyword list section, there are icons for selecting keywords and exporting keywords. Please click the export icon to start it.
 |
|---|
| Figure 14 - Keyword export button on the rank dashboard. |
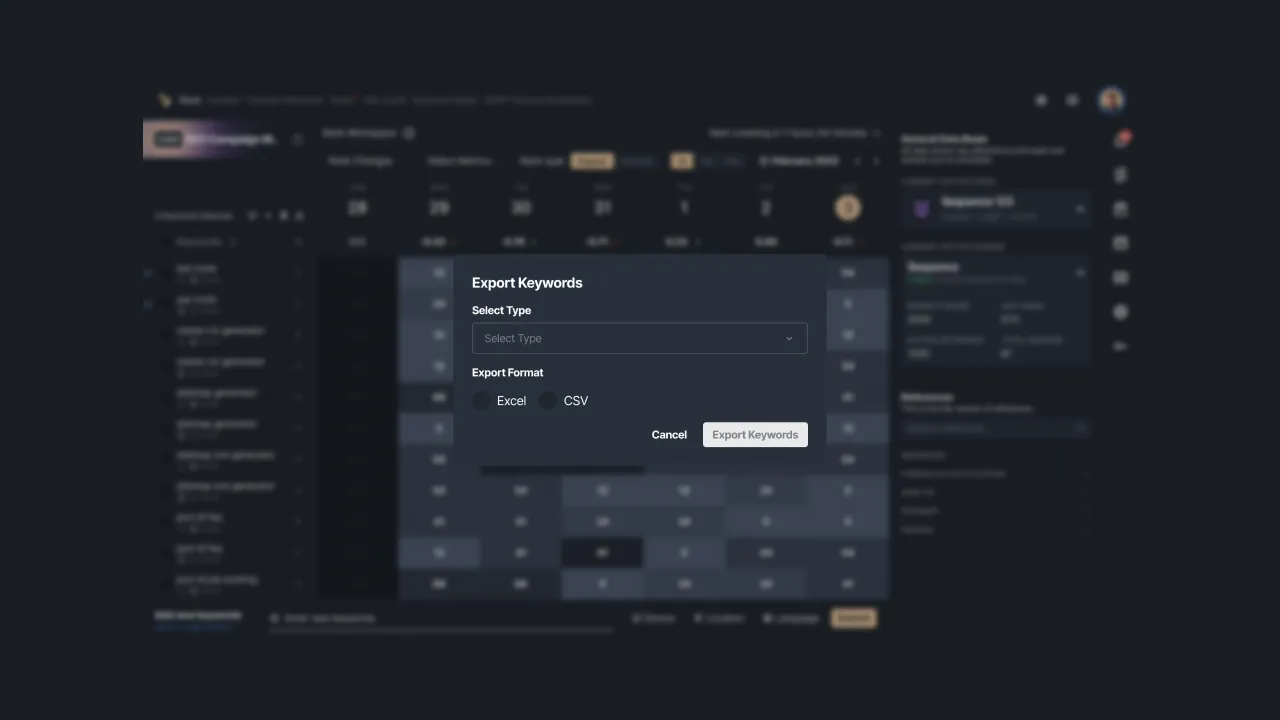
After that, the system will show a keyword export setup where the user can choose the type of export such as by metrics and by date as well as the desired file type. If you select export by metrics, the data obtained are all keyword metrics such as:
- keywords
- SEO features
- device
- market language
- Market location
- Search volume
- CPC
- competition
- competition category (low, medium, high, n/a)
- indexed URLs
- keyword created at
- last crawled time
- is bookmarked (to indicate whether the keyword is added to bookmarks)
On the other hand, if you choose to export by date, you need to set the time range beforehand to get the ranking changes data for the keywords you are tracking. The maximum timeframe that can be specified is 90 days and the following is the data obtained:
- keywords
- device
- market code (id-ID, en-ID)
- market language
- market location
- keywords
- rank history according to the selected type (organic/absolute)
 |
|---|
| Figure 15 - Set up keyword export via the rank dashboard. |
If you have selected your preferences, please click the Export Keywords button. Wait a few moments until the file is downloaded automatically. For exporting all keywords, the formats to choose from are Excel and CSV.
Exporting Specific Keywords
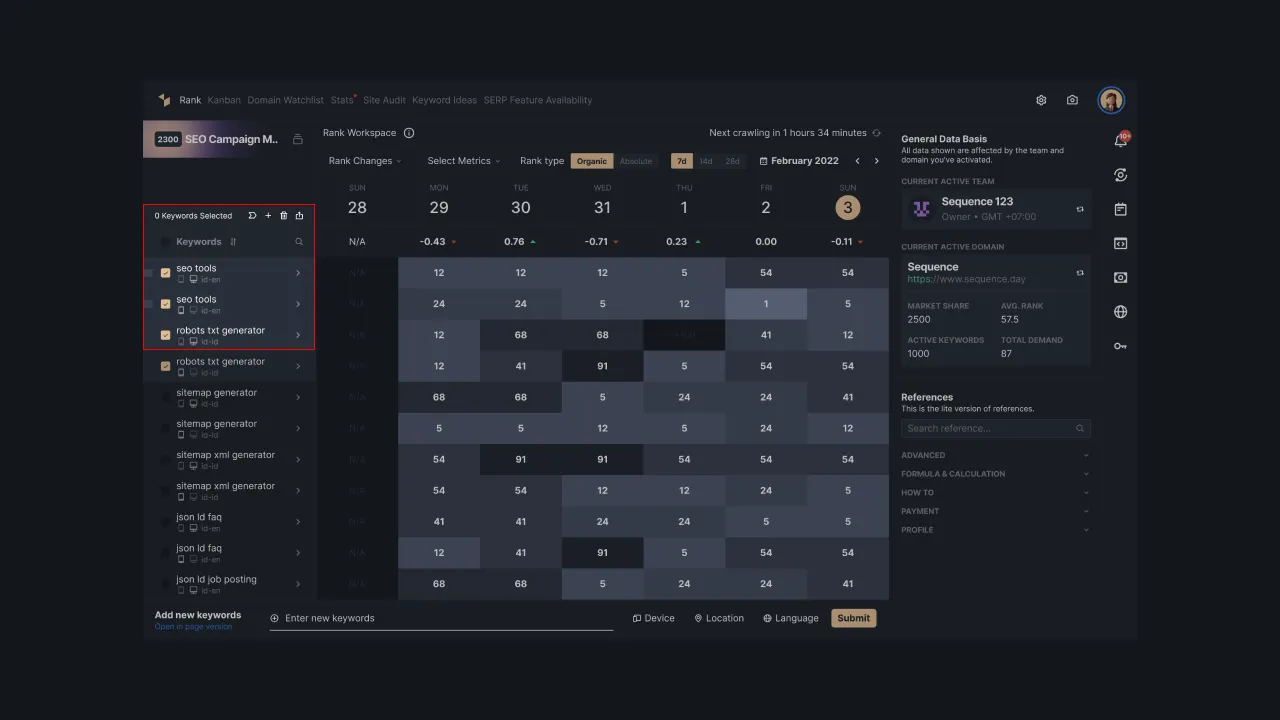
In addition to exporting all the keywords in your keyword list, you can also export only certain keywords. To do this, select one of the keywords you want, then open the Keyword details.
 |
|---|
| Figure 16 - Keyword display details of the selected keywords |
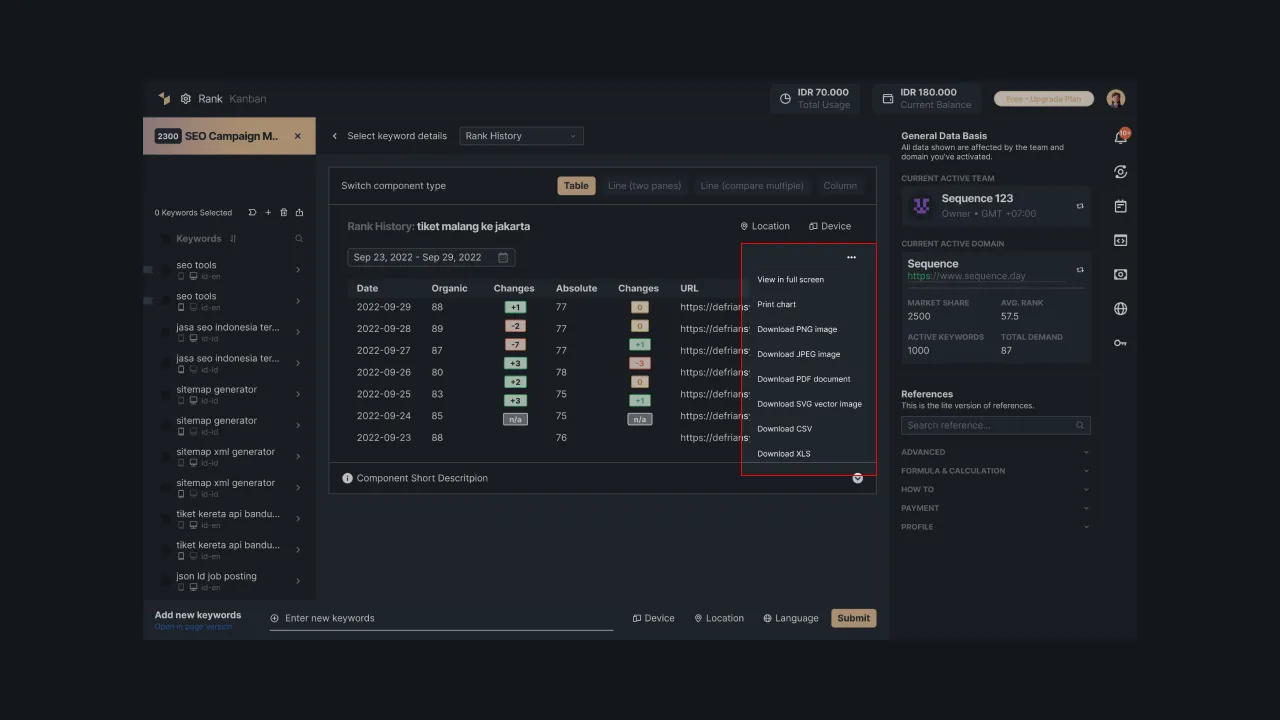
You can export keyword data starting from rank history, SERP archives, and search volume. Click the three dots at the top right to download or export the displayed data.
 |
|---|
| Figure 17 - Click the three dots to download or export in a specific format |
The file types that can be selected will differ depending on the type of data display. For example, line and column graphs can be downloaded in PNG, JPG, PDF, and SVG formats. Meanwhile, table data can be exported in Excel or CSV files.
Crawl Issue
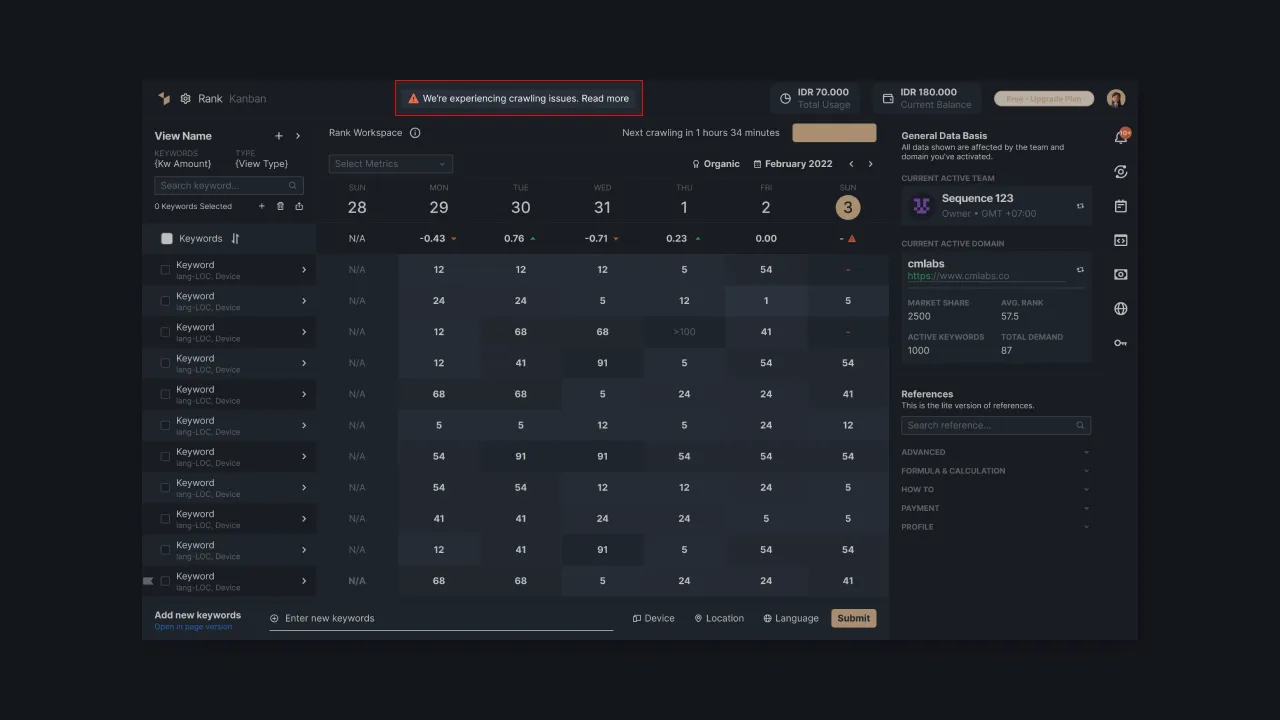 |
|---|
| Figure 14 - crawl issue warning |
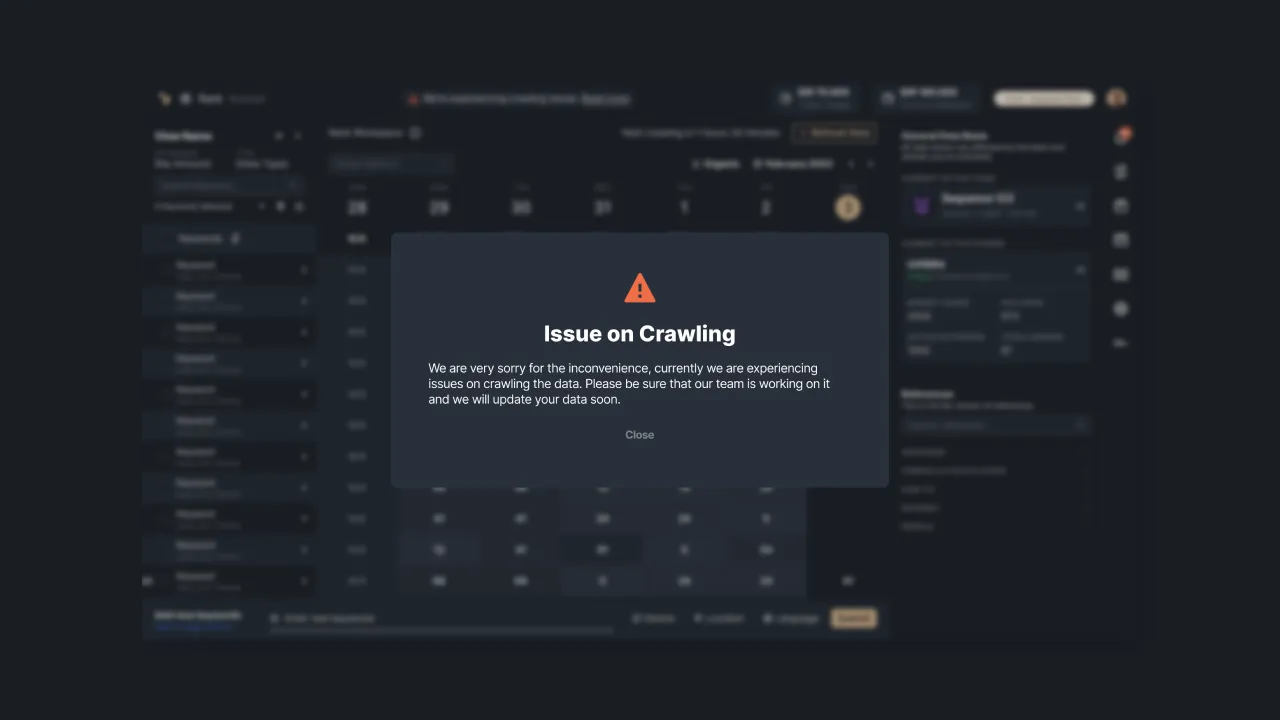 |
|---|
| Figure 15 - crawl issue detail |
If you encounter a warning on crawling issues like the image above, then some data can't be displayed. There are two possibilities that are happening so that you cannot receive data updates namely system errors and third-party errors. The following is an explanation of the two errors.
System Error
error on our system that can cause a failure when the data is updated. This could be because the system failed to fetch all the latest data or only part of it. For this issue, our team will fix it by re-crawling the data.
Third-Party Error
Errors on third parties may result in the unavailability of up-to-date data. For this matter, we will monitor the third party and serve the data once it is available.
Data Influenced by Crawl Issue
Here is the data that may unavailable when the crawling issue occurs.
- Rank (Organic & Absolute) including the changes
- SERPs
- Search Volume
- Market Share
- Total Demand
- Brand Position
That is a brief explanation of the components found on the Rank Dashboard and Keyword Details pages in Sequence. You need to know these components to understand the ranking tracking data that is displayed. For more information, please contact us at support@sequence.day, our team will be happy to assist you.